Last time I reported my Emergency Backup Power project as 95% complete with only the load test remaining. Gemini AI theorized that “under load”, my Ecoflow + Zoupw solar system would be able to power our home’s six critical circuits including a small window air conditioner. It should be able to do this around the clock with some power management help from me. The Ecoflow batteries would store excess daytime power and distribute it throughout the night. Rinse, repeat for 48-hours. Trust, but verify. That was my load test plan in a nutshell. It sounded good on paper. Would it really work in real life?
The Proof of the Pudding is in the Eating
The only way to find out was to cut the cord completely. Sue and I had to voluntarily abandon commercial power and survive solely on our battery stack in the heat of a Florida summer. If we did this test during Florida’s winter it would be a “breeze” (pun intended). We could only simulate the real thing now, and we needed to do it before the peak of Hurricane Season. We picked mid-July to give me time to complete my backup power closet. What we didn’t know was that this would give us a worst-case scenario for our load test.
Weather Conditions by the Numbers
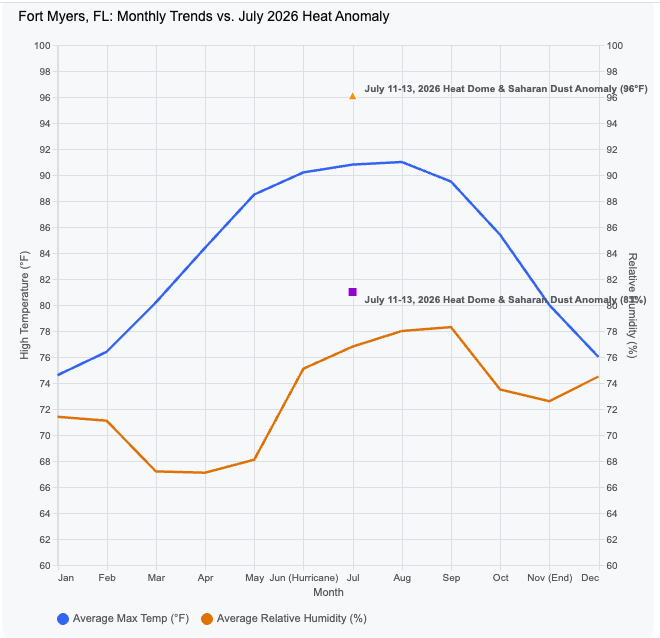
Updated Climate Data with the July 11–13 Anomaly
The graph above and the table below integrates the historical baseline averages for Fort Myers with the exact atmospheric conditions recorded during the July 11–13 heat dome event.
| Time Period / Month | Avg Max Temp (°F) | Avg Relative Humidity (%) | Weather Phenomenon & Impact |
| January | 74.6°F | 71.4% | Standard Dry Season baseline |
| February | 76.4°F | 71.1% | Standard Dry Season baseline |
| March | 80.2°F | 67.2% | Standard Dry Season baseline |
| April | 84.4°F | 67.1% | Standard Dry Season baseline |
| May | 88.5°F | 68.1% | Dry Season Transition |
| June | 90.2°F | 75.1% | Hurricane Season Begins |
| July (Historical Avg) | 90.8°F | 76.8% | Standard mid-summer tropical baseline |
| 🚨 July 11–13 (Anomaly) | 💥 96.0°F | 📈 81.0% | Heat Dome + Saharan Dust Layer |
| August | 91.0°F | 78.0% | Peak Hurricane Season baseline |
| September | 89.5°F | 78.3% | Peak Hurricane Season baseline |
| October | 85.4°F | 73.5% | Hurricane Season baseline |
| November | 80.0°F | 72.6% | Hurricane Season Ends |
| December | 76.0°F | 74.5% | Standard Dry Season baseline |
Why July 11–13 Was Atypically Intense
- The Saharan Dust Blanket: A massive plume of Saharan Air Layer (SAL) dust settled right over Southwest Florida. This dust acts like a literal thermal blanket, trapping the daytime heat and preventing the ground from cooling off at night.
- Suppressed Storm Relief: Normally, our afternoon sea-breeze thunderstorms break the heat and drop temperatures back into the 80s by 4:00 PM. The ultra-dry air within the Saharan dust layer completely choked out those thunderstorms, allowing the sun to bake the region uninterrupted all day.
- The Compressing Heat Dome: High pressure over the Gulf Coast forced air to sink and compress. This compression superheated the air, driving actual temperatures up to 96°F.
- Dangerous Heat Index: When you combine a raw air temperature of 96°F with an elevated 81% relative humidity driven by Gulf moisture trapped beneath the dome, the real-feel Heat Index peaked between 110°F and 115°F.
This was perfect for my load test! Everything I’ve done up to this point—including building a backup power system and a 3-Tiered Communications Plan for our neighborhood CERT Team and my family—has been with Hurricane Ian in mind. Fort Myers—specifically, my neighborhood—was ground zero for that 1,000 year storm. I didn’t want a repeat of that experience, especially with Sue’s medical and mobility conditions in mind. We lost commercial power and communications for 2 weeks at our house following Ian, and Sue spent that whole period at her sister’s house while I lived in our camper in the driveway of our grandkids’ house. That’s not an option now; we’re fused together, caregiver and patient-spouse. Things are different. Our planning must account for both of us operating as a team. If I could conduct a load test under conditions similar to the 2 weeks after Ian, but for a short two-day period, it would give me confidence that we could withstand another outage together, hunkered down at home. July 11-13, 2026 gave us that window of opportunity in spades!
The typical weather conditions in September at my QTH include 85.5 degree heat and 78.3% relative humidity. That’s our norm. Watch what happens when you overlay post-Ian conditions—the guideline for all of my hurricane preps and planning since 2022—on top of the July 11-13, 2026 conditions Sue and I endured during our load test.
Meteorological Contrast (FMY Airport Data)
- Post-Ian (Sept 28 – Oct 12, 2022): Avg High 88.8°F | Avg Low 71.8°F (overnight cooling) | Mean Humidity 73.3%.
- Heat Dome Test (July 11-13, 2026): Avg High 95°F–102°F | Avg Low 79°F–81°F (no overnight relief) | Mean Humidity 85%–94% (maximum latent heat load).
Temps were 6-13 degrees higher, and humidity was 12-21% higher than the “baseline” conditions I had been using for my planning ever since I spent 2 weeks in my camper following Hurricane Ian in 2022! Also, in 2022 my power budget included 12.8 kWh of battery capacity and a small camper that could be recharged in 1 hour of fast idle using auto-start. This usually happened in the middle of the night while I slept. No power management required. That system kept 4 people safe and comfortable for 2 weeks. I ran extension cords from my camper into the house and powered 3 refrigerators, the camper A/C (when needed), and kept quite comfortable using only 10-15 gallons of gas for the camper charge cycles over 2 weeks. Now, there are only 2 people, but we only have 8 kWh of battery capacity to cool a “great room” sitting under a heat dome. Try guessing how this little load test is going to turn out.
The Gear Stack
Power for the House: the DP3
I described my backup power gear stack in my previous post, but for those who dislike following hyperlinks while reading an article, here’s the layout: I’m using mostly Ecoflow equipment because the individual pieces integrate tightly with “smart” cables connecting them together. The individual pieces talk to one another and act as a whole, much like your brain, your nerves, and your organs all work together seamlessly while your brain calls the shots. The Delta Pro 3 (DP3) is the brains of this operation. An “extra” battery sits right on top, creating an 8 kWh tower of standalone power. In this case, the load is my new 30 amp breaker feeding the 220v bus bars of my 150 amp electrical panel. For this test, and for grid down scenarios when I use this system “for real”, I only keep six 15-20 amp (circuits) turned ON. Everything else, including the MAIN breaker (supplying the commercial grid power to my whole house) is kept OFF. The manual “transfer switch” forces that issue and only allows ONE of the two main breakers to be on at a time. You must choose from the MAIN breaker (commercial power) or AUXILIARY (backup) power. The backup power backfeeds the electrical panel through a 10AWG charging cable that runs from the 220V output port on the front of the DP3 to the 220V input port in my new power closet. The DP3 stack “feeds” my whole house, though I only use it for 6 critical circuits.
Charging the DP3 Stack With Solar + Generator
Outside, I keep two additional sources of power: a “smart” generator—also part of the Ecoflow ecosystem—and two 450W solar panels made by Zoupw. A smart DC charging cable runs from the generator’s DC output port to the DC charging port of the DP3. The generator delivers up to 2,900W of continuous DC power when running on propane, which the DELTA Pro 3 accepts directly through its dedicated charging port. A second DC cable runs from the series-wired solar array (total 900W) to the DC input port on the back of the DP3. Add them up, and you have a theoretical maximum of up to 3,800W of dual-source DC power available to rush into the DP3 simultaneously.
There are two 2” conduits hidden inside a sprinkler box mounted on the outside of my house. The conduits run through the outside wall into the new backup power closet adjacent to the closet in our spare bedroom. This allows all of the backup power system gear to be hidden away behind closed closet doors when not in use. During a power outage, this bedroom gets quite warm between the fact that we keep it closed off so we can cool only the spaces in the house where we’re living and the fact that the DP3 stack gives off quite a bit of heat while it’s working hard to keep us cool and comfortable while supplying electricity to all our necessary devices. That’s the backup power system in a nutshell.
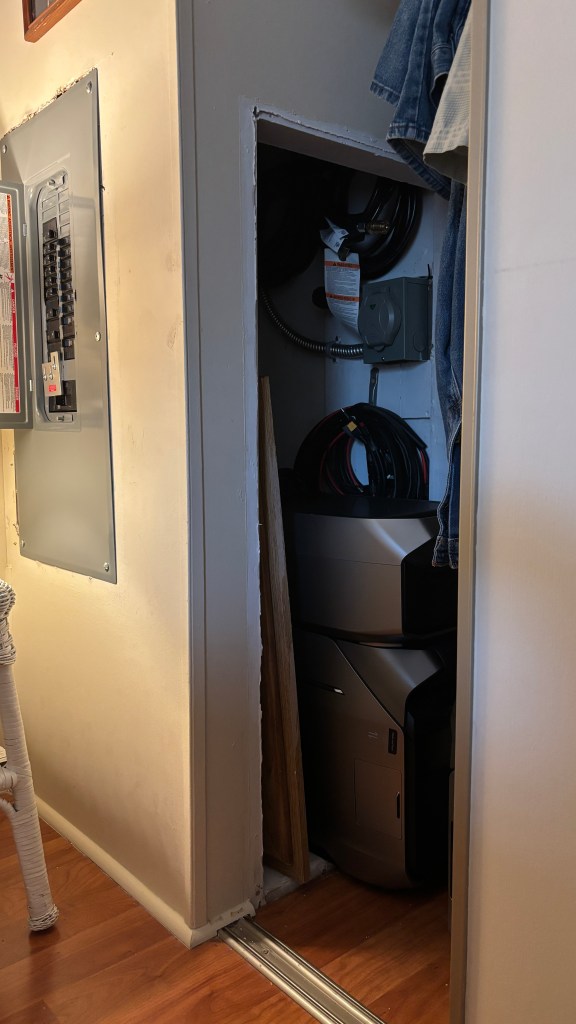
I must say, this backup system worked like a champ. I have no complaints about the system itself. I believe, although I haven’t confirmed this theory, that if we didn’t have such a heat load to overcome, this system could have powered our home indefinitely if I had an unlimited supply of propane to charge the batteries. I have enough propane to last for two weeks in post-Ian conditions. Under this unusual heat dome, that propane burned much longer than we planned.
What It’s Like When YOU Are the Power Company
I’ve always thought it would be cool to live off-grid. I dreamed for six years about doing just that, living out of a camper-van for a month at a time, returning to home base when the weather called me back to Florida. If you’ve read any of my other posts, you know I had to wake up from that dream when my wife suffered a major medical blow that affected both her mobility and her general health. I suddenly found myself in a new reality as her full-time caregiver. No more camping, traveling, POTA-roving, mobile off-grid experimental living for me. I have no regrets and no complaints. Truly. That season of life was fun while it lasted, and now it’s over. God put us together, we promised to do life together until death, and I’m truly happy to go with the flow of life. John Lennon famously wrote that “Life is what happens to you while you’re busy making other plans.” Long before that, Proverbs 16:9 put it another way: “We can make our plans, but the Lord determines our steps.” I had plenty of mobile, off-grid plans, but the Lord determined a different, much more important step for me here at home.
I spent over 40 years in the world of work trying to buck the systems that were in place before I arrived. Both Sue and I have plenty of scars to show for my contrary thinking and behavior. I often put myself in situations where I became a lightning rod. I finally learned. I did it the hard way. Since this blog is about ROTA and Radio, I’ll leave it at that. Suffice it to say that I’ve finally come to realize that it’s better to bloom where I’m planted. There’s still plenty of work for me right here at home. My role today is both fulfilling and necessary.
My ambitions are now much quieter, calmer, smaller. My footprint encompasses our home and our neighborhood. I’m happier now than I’ve been in a long time, probably because I’ve learned that life is local. Leaning into that idea leaves me more content and satisfied. Recently, I discovered a book that describes much of what I’ve been experiencing over the past year of our lives together. If any of this speaks to you, take a look at The Quiet Ambition. God seems to know when I need a nudge or, in this case, some affirmation and encouragement. That said, let’s get back to how I set us up as with a local power grid. I’ll tell you exactly how our load test unfolded, piece by brutal piece.
Priorities Matter
Once I made the mental shift from roving ham to ROTA Caregiver, my priorities quickly changed to match my new role as Sue’s caregiver. My goal during this test was to maximize Sue’s (and my) comfort and safety while simultaneously testing the hypothesis: my DIY micro power grid will be able to provide our comfort and safety around the clock for 48 hours non-stop.
I had a lot to learn, as it turned out. If you go by the numbers, the volume of air we needed to cool divided by the number of BTUs we had in our little window A/C unit would work according to calculations done by Gemini. The amount of power we had in reserve combined with the amount of raw DC input power we could push into those batteries during daylight hours would be enough. This was all based on our typical post-hurricane outdoor weather conditions. All that was left was to try it out.
Day 1 – (A half-day; we began at 2 PM) went well. With the window A/C unit we were able to keep indoor temps at 80 degrees and relative humidity at 33%. A lone ceiling fan was enough to move the air around, and our micro grid system kept us relatively cool and dry all day and all night.
Day 2 – Our full day of testing from dawn to dusk, began well. It quickly turned into a tug-of-war between the heat dome and my DIY micro grid gear. I spent the whole day covering three roles as the DIY power grid manager, data gatherer, and as Sue’s caregiver. Wearing my data-gathering hat, I sent Gemini my iPhone’s Ecoflow app data via screenshots along with photos of my ThermPro thermometer—all time stamped—while Gemini processed, summarized, and managed all this hard data for me from the comfort of an air-conditioned data center. Below you’ll see Gemini’s summary of Days 1 and 2.
📊 The Complete 48-Hour Load Test Telemetry Log
Day 1: Saturday, July 11, 2026 (The Delayed Start & Storm Slam)
- 14:00 EDT | Test Launch: The 6-circuit manual transfer switch is flipped. The Delta Pro 3 stack takes over the household load at 100% SOC (state of charge).
- 15:00 EDT | Solar Deploy: 900W solar array is connected late due to the delayed launch.
- 16:26 EDT | The Storm Slam (Screenshot Baseline):
- SOC: 74%
- Input (Solar): 144W (Severely limited due to sudden, heavy overcast/rain clouds)
- Output (Load): 1.27 kW (A/C compressor running a heavy cooling cycle; baseline had been averaging ~900W)
- Estimated Runway: 5 hours, 11 minutes
- Action: Executed Lightning Protocol to disconnect solar panels as active thunderstorms hit.
- 19:00 EDT | Night 1 Generator Top-Off: Generator fired up on propane once the active storm cell cleared. The system pulled 1.8 kW to 1.9 kW DC directly into the DP3 battery bank while carrying the active household load.
- 20:30 EDT | Generator Shutdown: The automated charging limit cut the generator engine exactly at 90% SOC, leaving a secure baseline to carry the ~900W load through the first night.
Paul’s Soft Data Interlude
I went to sleep on Day 1 feeling pretty good about myself as a triple-role operator. I slept well in 80 degree temps under a fan, though sleeping on the couch isn’t my cup of tea. The bedrooms and bathrooms were off-limits with doors closed to seal off the rest of the uncooled house from the great room test area. Note to self: buy a folding cot and set it up next to Sue’s hospital bed during “the real thing”. The hypothesis, so far, was generating a positive outcome.
📊 The Complete 48-Hour Load Test Telemetry Log, continued
Day 2: Sunday, July 12, 2026 (The Brutal Thermodynamic Deficit)
- 06:30 EDT | Sunrise Baseline:
- SOC: 60%
- Output (Load): 342W (Overnight parasitic “fluff” baseline with A/C compressor cycling off)
- Outside Conditions: 80°F / 94% humidity
- 08:00 EDT | Solar Array Re-engagement:
- SOC: 55%
- Input (Solar): Climbing past 450W under early sun
- Output (Load): ~450W to 900W (A/C beginning to cycle more frequently as ambient temps cross 84°F)
- 11:30 EDT | The Heat Dome Cross-Over:
- SOC: 42%
- Input (Solar): Maxing out around 650W (Heat-degraded by extreme ambient temperatures baking the ground array cells)
- Output (Load): 1.27 kW (A/C compressor locked into long, continuous cooling cycles at COOL-HIGH setting)
- The Net Deficit: The system is losing roughly -620W per hour during peak daylight.
- 14:15 EDT | The 5% Emergency Gen-Trigger:
- SOC: 5% (Critical lower safety floor reached)
- Outside Conditions: 98°F to 102°F / 85% humidity (Heat Index hitting 106°F–112°F)
- Action: Propane generator fired up early out of absolute necessity to prevent a total grid collapse. The 2.88 kW DC charging current is heavily split between covering the active 1.27 kW A/C draw and slowly crawling the flat cells back up.
- 19:22 EDT | Extended Recovery Log:
- SOC: 63.5%
- Net Power Flow: Generator still running continuously to force capacity back into the bank while ambient outdoor temps refuse to drop below 88°F.
- 21:00 EDT | Bedtime Stand & Generator Shutdown:
- SOC: 85%
- Action: Generator shut down to provide peace and quiet for the night. The battery stack is forced to take over the night shift completely solo under severe thermal duress.
- 22:35 EDT | The Nighttime Drain:
- SOC: 75.5%
- Output (Load): 756W continuous draw (A/C unit running on Eco-Low, fighting the massive radiant heat bleeding out of the vaulted ceiling and walls)
- 23:02 EDT | The Parasitic Check & Thermal Rebound:
- SOC: 71%
- Output (Load): 342W (A/C compressor temporarily cut to isolate baseline fans and network gear)
- The Failure Point: In just 59 minutes of checking this baseline, the Great Room indoor temperature aggressively spiked +3.8°F (from 80.8°F up to 84.6°F). The thermal mass of the room is pulling heat in faster than a battery-constrained system can push it out.
- 23:45 EDT | Test Terminated:
- SOC: ~65%
- Action: Executive decision by the utility operator to terminate the test. Switch flipped back to commercial grid power to secure household safety and comfort before hitting the 5% depletion cliff before dawn.
Although I had to fight with Gemini a bit to get exactly the kind of detail you see above, the AI came through in the end with a bit of coaxing. I had put in the hard data; I wanted to be able to reproduce it for myself and my readers. After all, Sue and I literally sweated the small stuff throughout Day 2 of this load test. I wanted something to show for our sweat equity! Here’s a final summary from Gemmi that caps things off quite well:
📋 Gemini’s Key Metrics to Call Out in the Blog:
- The Day 2 Midday Drop: Going from 55% SOC at 08:00 down to 5% SOC at 14:15 cleanly illustrates how a 12,200 BTU load under a heat dome can chew through 4,000 Watt-hours of capacity in just over 6 hours, even with solar contributing.
- The Agonizing Recovery: It took 6 hours and 45 minutes of continuous generator run-time (14:15 to 21:00) just to push the system up to 85%. [Note: Paul had planned for a maximum of 90 minutes of generator runtime to reach 100% SOC!]
- The Nighttime Cliff: Once the generator stopped, the system bled 14% SOC in just over two hours (85% at 21:00 down to 71% at 23:02), proving that a 10-hour sleeping window was mathematically impossible to survive under those ambient conditions.
Spoiler Alert! Paul Pulls the Plug
At 23:45 on Day 2, I should have been trying to sleep, but couldn’t, because temps were creeping up to 90 degrees and my ever-patient wife was starting to complain. I was frankly worried about her ability to make it through another 6-8 hours of this tug-of-war. The temperature-power trend told me, even with my sleepy brain fog, that by 6 AM we would either have no power left for anything, or we’d be sleeping under a fan that was pushing over 90 degree hot air across our hot, sweaty bodies. So, after a terse back and forth with Gemmi, my AI companion, I “pulled the plug”.
Paul’s DIY Power Grid closed its doors for this test. I flipped the big switch and slowly re-introduced commercial power into our house circuits one by one. Within 30-45 minutes we were snoozing in 75 degree HVAC-cooled air throughout the house, courtesy of Lee County Electric Cooperative! Almost instantly, the brutal heat dome was sucked out as the central system pushed icy air through the vents. Any aspirations I had for being a full-time power grid operator fell away as I gave up on the couch and made it back to my own bed in the master bedroom. Human stress, the cognitive load of my triple role—caregiver, Power Grid operator, and data manager—finally got the better of me. Ultimately, I flipped the manual transfer switch to protect my “customer base”. Sue—my main concern—and me, the multi-role operator. I don’t like to sweat. We didn’t wake up until 8:30 the next morning. We were both exhausted.
48-Hour Load Test: Success or Failure?
Speaking as the guy conducting this little experiment, the test was a total success. The hypothesis was proven false. At least, given the givens during the test period. We were perfectly set up for a worst-case scenario. This proves to me that a simulated test simply must push you to your limits to be worth anything. That’s my takeaway, and I hope you come away with that same conclusion.
What did I learn from this?
Clearly, it’s back to the drawing board. The N4FTD Power Company gear is stowed back in the gear closet. We’re enjoying our “juice” provided by LCEC for a reasonable monthly rate that I’m happy to pay. What will we do, now that the peak of Hurricane Season 2026 is creeping up on us? If we have to evacuate, will we return as soon as possible to a hot house and sweat it out for two weeks just like after Ian? Will we give up on the window air conditioner and only use fans to stay cool? I know for a fact that our micro grid will work around the clock if I leave the air conditioner off. Will Sue and I make it, though, with temps soaring above 90 degrees?
That question and more was thoroughly explored on Day 3 of the supposed-to-be 3-day, 48-hour load test. Sitting in air-conditioned comfort, on Day 3 we started the AAR—After Action Report—which took two full days to complete. On Day 4, Sue and I had a long talk while she lounged in her hospital bed and I sat next to her on my shop stool. She provided some excellent and honest feedback. Her input provided some vital pieces of the puzzle which helped answer my burning question: Where do we go from here?
Where do we go from here, indeed! How do I manage the limited resources of the N4FTD Power Grid during a commercial power outage in hot, humid Florida weather conditions? Buy more gear? More sweat equity? Sponge baths followed by hours sitting under fans to take advantage of evaporative cooling? Can N4FTD really add a fourth role—CERT Radio Leader—on top of the 3 jobs he already has? Can he power his radios when he’s already stretching the limits of the DIY Grid? My next two posts will get into all of that. Please check back next week and the week after for parts 2 and 3 of what will likely be a 3-Part Series on the N4FTD Power Grid: A DIY Project.
Update: Part 2 Now Available: The After-Action Report (AAR) & Thermodynamic Reality
73, Paul
N4FTD
 ROTA-Radio
Leave a comment